Summary
The ISA overview is a graphical representation of the current item in relationship with other items within its ISA (Investigation, Study, Assay) structure.
Its purpose is to give an easy visual overview, and also can be used to navigate between items in the view. By double clicking on a node, you can navigate directly to that item. The title and description of the selected item is shown at the top; text that is long can be shown in full by hovering the mouse over the text.
The overview also provides the ability to modify the layout and export an image for presentations and reports.
The screenshots that follow are taken from the example at https://demo.seek4science.org/investigations/2
Icons legend
To help identify the ISA elements, below is a summary of the icons used.
SOPs, Data files, Documents and Presentations have icons according to their filetype.
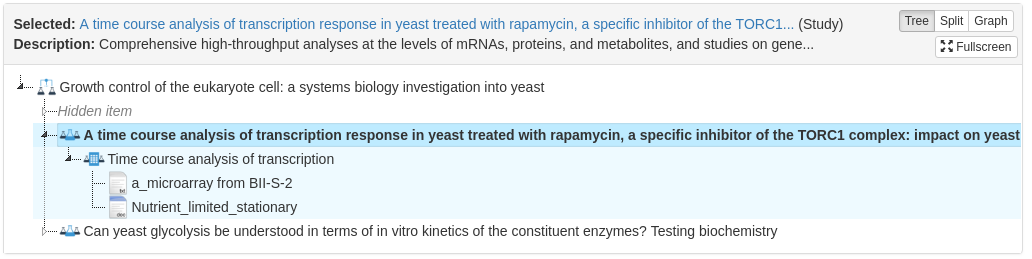
Tree view
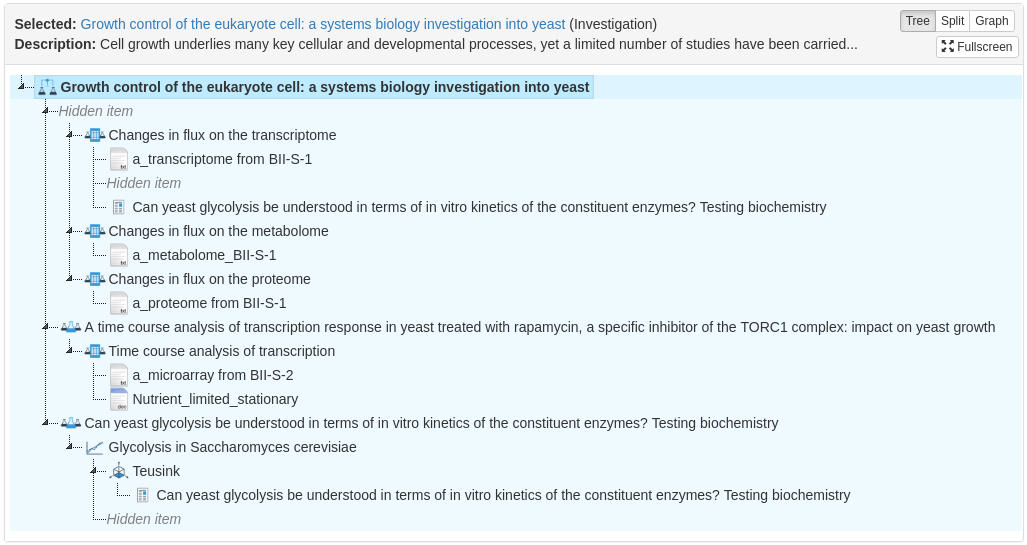
The tree view is the default view, and shows the ISA structure as folders, similar to a file browser. Initially, the current item and anything below it will be shown in an expanded state, whereas other items are shown collapsed. The collapsed items can be expanded by clicking on them. The items that fall under the currently shown item are also highlighted with a faint blue background.
For example when viewing a Study, that Study is shown expanded, whereas the sibling studies are shown collapsed.
Where items have more than one parent, for example a Data file associated with more than one Assay, then it will be shown under each of them.
You can jump to an item on the tree view by double clicking on it.
A full screen view of the tree can be shown by toggling on the “Fullscreen” button, and can be reverted by clicking again or pressing the ESC key.
Graph view
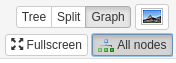
The graph view can be shown by clicking the “Graph” button at the top right. This shows a graphical view of highlighting the item within the network. By default, only its immediate neighbours are shown in full, with other nodes smaller. Immediate connections are also highlighted. This helps reduce clutter for complex graphs and get an immediate visual idea of the place of the current item in the network.
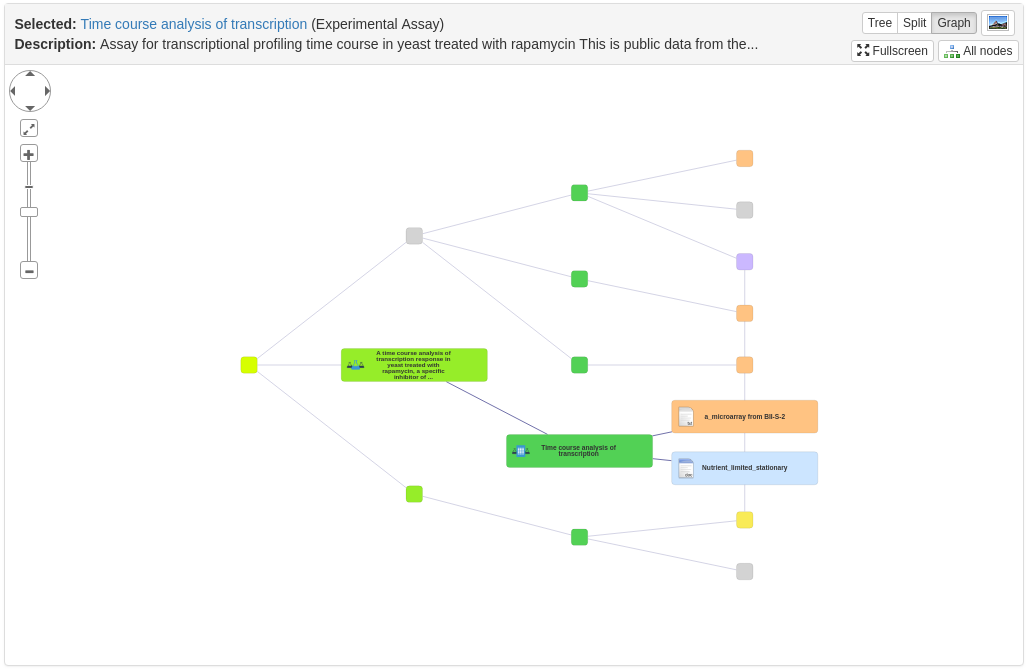
The graph can be interacted with by clicking on individual nodes, which will expand along with their nearest neighbours. The title and description of the selected item will also be updated at the top.
If you wish all nodes to be shown in full, then there is an “All nodes” toggle button.
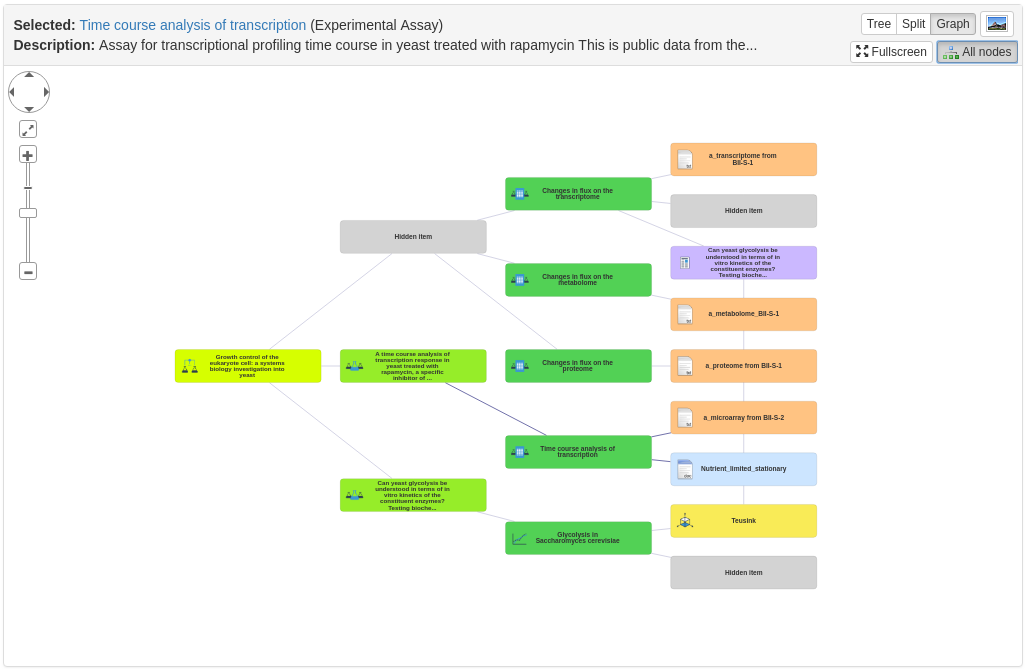
You can drag the graph around with the mouse, and zoom in and out using the controls on the top left. Individual nodes can also be dragged and repositioned.
As with the Tree view, you can also toggle full screen. In full screen mode it is possible to zoom in and out using the mouse wheel.
To export the graph as a PNG image, then click the button with a picture icon on the top right. This will pop up an image of the current state of graph which can be downloaded. The image is at a greater resolution, and more so if exported during full screen mode.
Split view
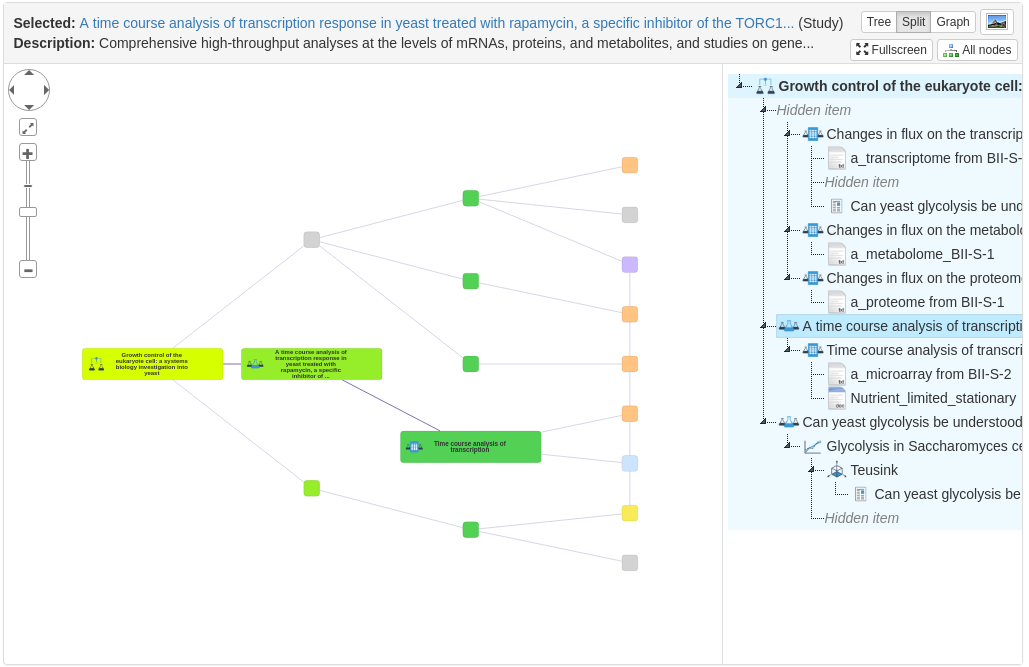
The Split view provides a combination of the Tree and Graph view, with the tree shown on the right. Clicking on one interacts with the other, so clicking on a tree node will also highlight it in the graph, and clicking on the graph will select the tree node and expand it if necessary. The split view works best when displayed as full screen.