About
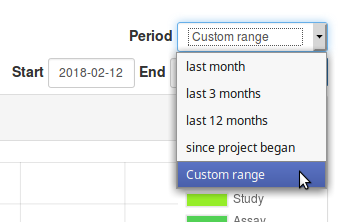
The Project Dashboard page contains various charts presenting metrics on activity within the project over a given time period.
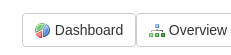
Accessing the Dashboard
The dashboard is accessible to all project members through a button on the project’s page.
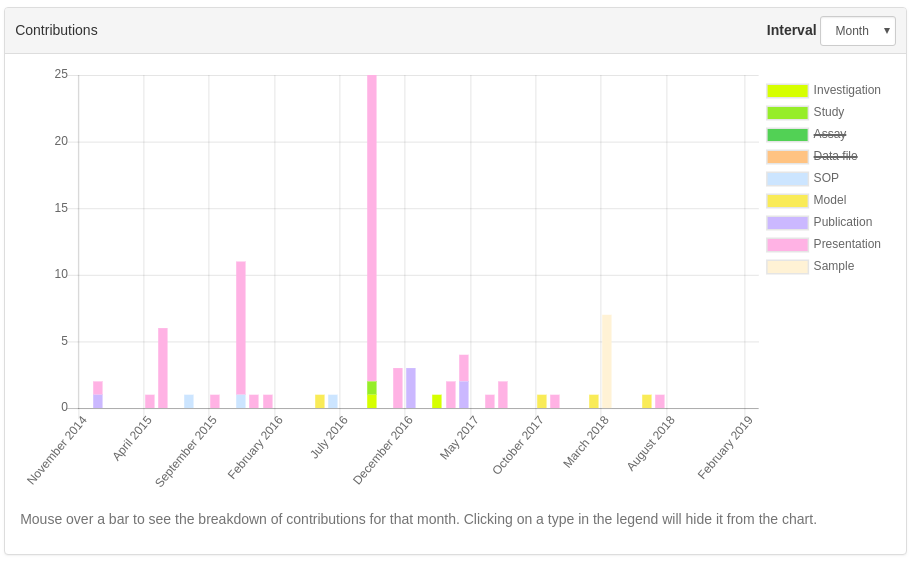
Submissions
The submissions graph shows all project assets that have been created over the time period. The interval can be changed to group results by day, month or year. Asset types can be excluded from the graph by clicking their entry in the legend on the right-hand side. Double-clicking an asset type will hide all asset types except that one.
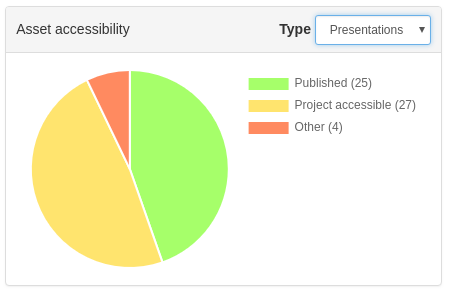
Asset accessibility
The asset accessibility pie chart indicates the accessibility of assets created in the time period. The “Type” dropdown lets you optionally filter by a specific asset type.
The three levels of accessibility are:
- Published - Assets that can be accessed (and downloaded if applicable) by anyone visiting SEEK.
- Project accessible - Assets that can be accessed (and downloaded if applicable) by members of this project.
- Other - Assets that are private, or have limited access.
Most viewed and downloaded Assets
The most viewed/downloaded asset panels show simple “top 10” lists of assets by their number of views/downloads over the time period. They can also be filtered by type.
Most active submitters
The most active submitters panel shows the top 10 people by number of submissions in the project over the time period. Creating a SEEK asset counts as a submission.